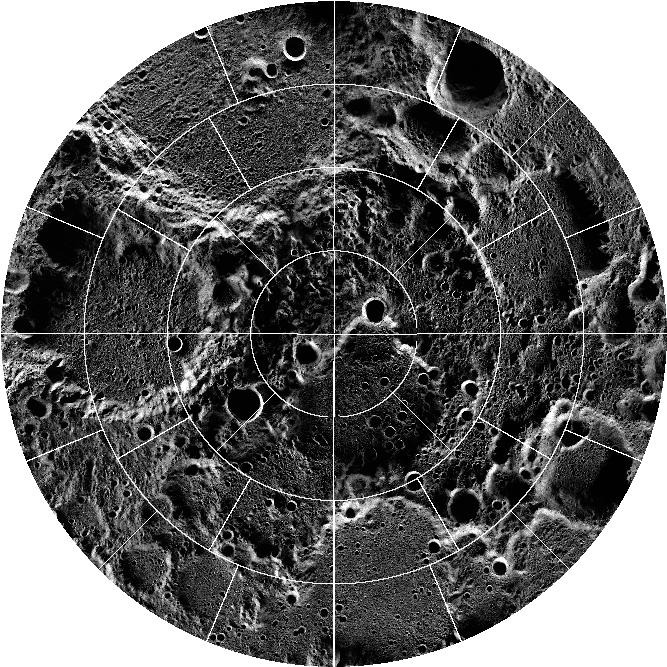
Controlled 1 m/pixel North Pole Mosaic
This is an average pixel value mosaic of a controlled mosaic consisting of 9687 NAC images of the lunar north polar region acquired between 2009 and 2014. Control solutions were performed using the ISIS jigsaw application using 405,532 points and over three million measures. The network was constrained using 16,302 points in 226 images that were tied to Lunar Orbiter Laser Altimeter (LOLA) track data. The residuals from the bundle adjustment performed by ISIS jigsaw were a solution variance of 0.40, with (in pixels) a mean of 0.52, a standard deviation of 0.48, and a maximum of 13.0. The illumination mosaics were created by selecting images with similar sub-solar longitudes and layering the images such that the most representative image (closest sub-solar point) is on top. These mosaics provide an idea of what the surface looks like with varying degrees of sub-solar azimuths. The illumination mosaics only cover some of the polar region; therefore, blank tiles containing no NAC data are omitted from the archive. The images were map projected using a polar digital elevation model derived from LOLA tracks. The mosaic range is 84 to 90 degrees and is stored as 40 polar stereographic map tiles.
The tiles have four latitudinal bands of 1.5 degrees radiating from the pole. There are four tiles in the first band (88.5 to 90 degrees latitude), eight in the second (87 to 88.5 degrees latitude), twelve in the third (85.5 to 87 degrees latitude), and sixteen in the fourth band (84 to 85.5 degrees latitude).
North Pole NAC Mosaic
NAC_POLE_NORTH_CM_AVG_P900N0000 - 1 meter/pixel
Supplemental Downloads